Phalanx 2.0 — DOM Integrity & Threat Monitor
Three layers of browser protection that keep you in control: an extension that scores every site before it loads, a native desktop command centre, and a decision on every alert that stays with the user.
Protection in Three Layers
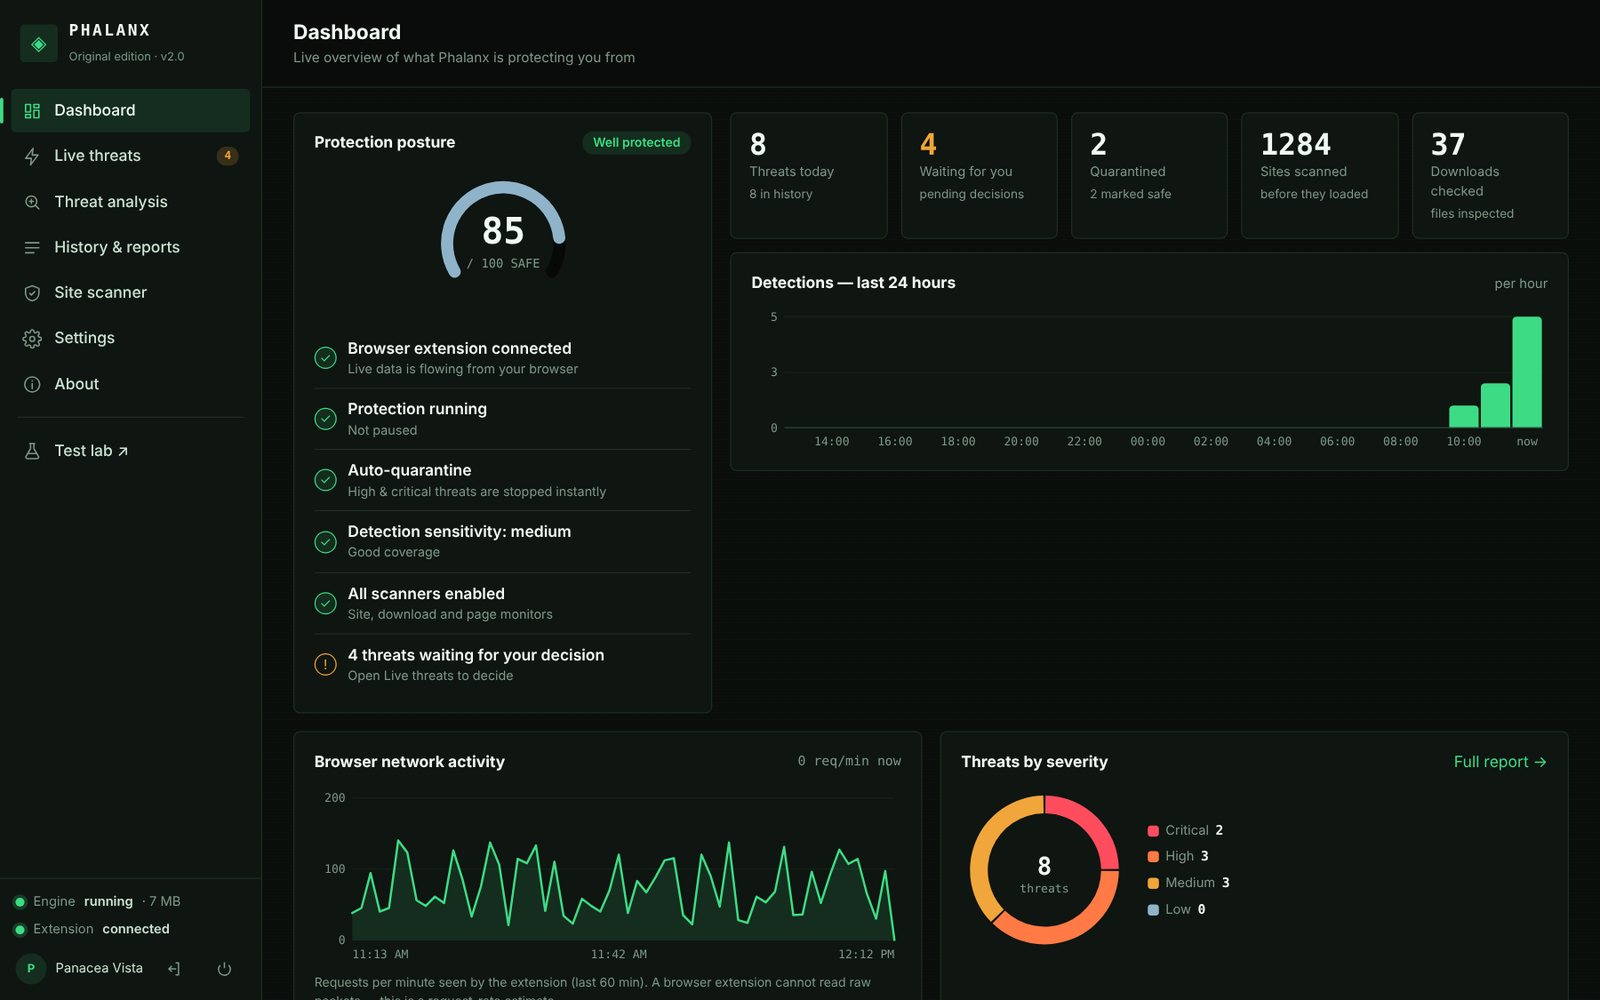
Phalanx 2.0 builds on the A.R.G.U.S DOM-interceptor concept and turns it into a complete product. The browser extension scores websites before they load, inspects downloads and watches pages for injected login forms, scripts, hidden frames and clickjacking overlays.
Phalanx.exe is the desktop command centre: dashboard, live threats, threat analysis, history and reports, site scanner and settings in one window. And you decide: every alert offers Resolved, Quarantine or Threat analysis.
How a Threat Is Handled
From the moment a page, download or DOM change appears to the moment it is resolved.
1. Observe
The extension watches sites, downloads and page mutations in idle time.
2. Score
Warning signs add weighted points on one 0–100 scale.
3. Compare
The score is checked against the chosen sensitivity.
4. Alert
One compact alert, gone after 3 seconds, with three choices.
5. Decide & log
Resolved, quarantined or analysed; kept in history.
Every Decision Stays With You
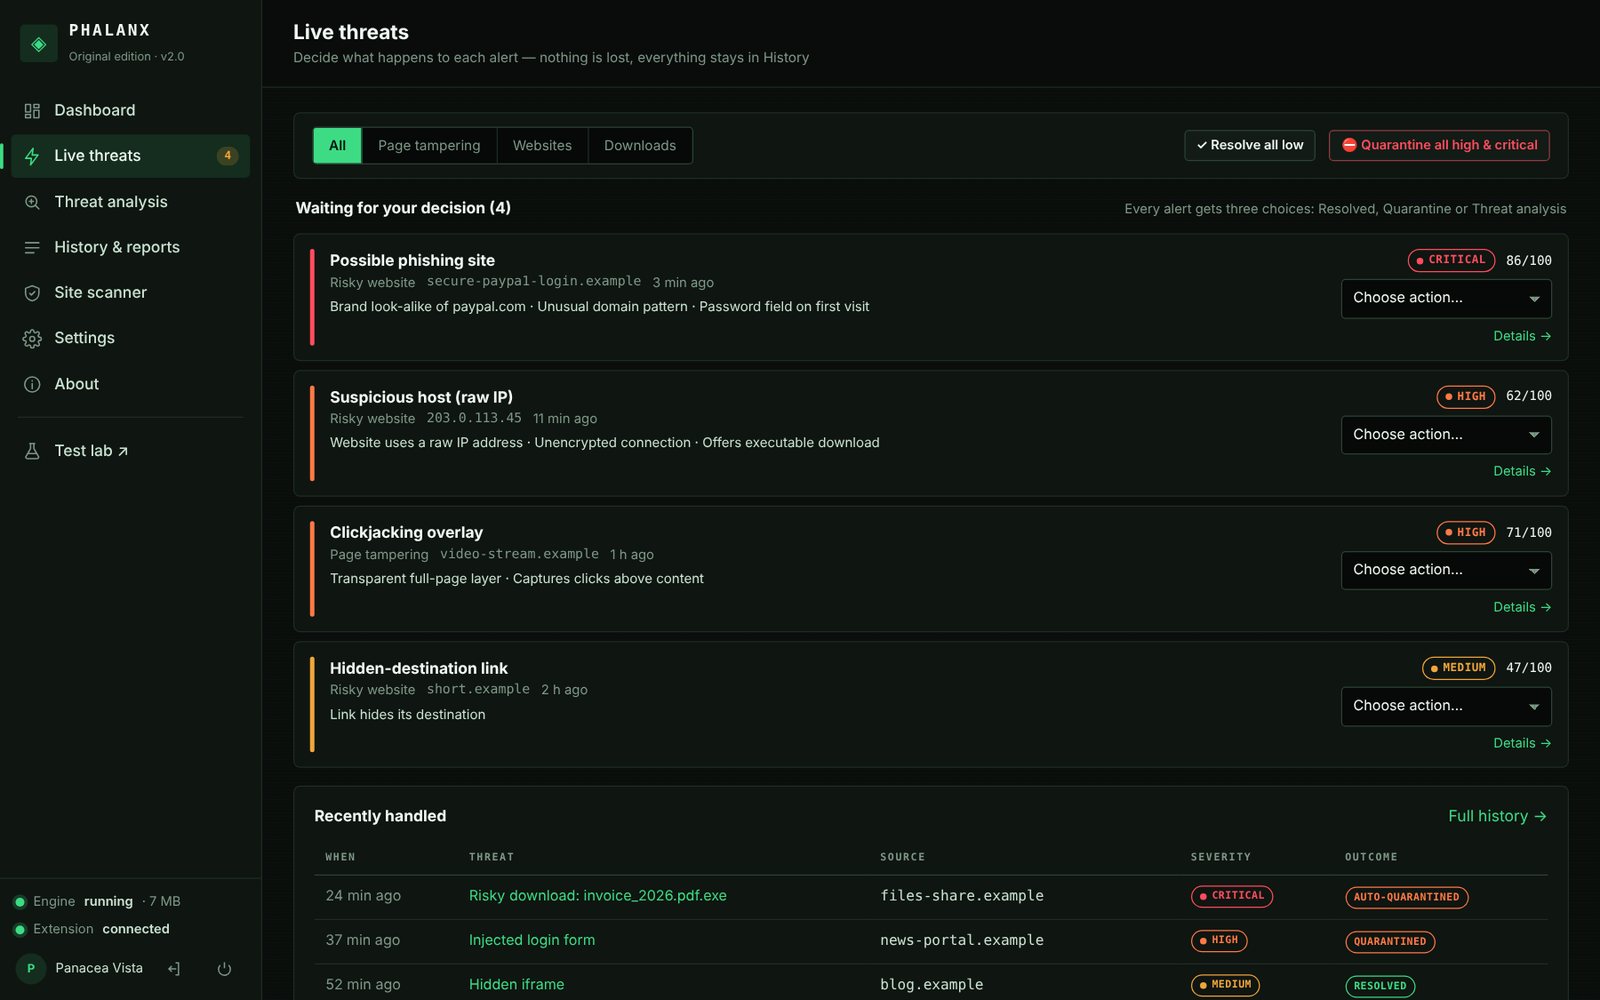
Live threats lists everything waiting for a decision, with the severity, score and the signals that triggered it. High and critical items can be handled automatically by auto-quarantine; everything else waits for you.
- Resolved: mark it safe and move on
- Quarantine: remove the element, cancel the download or block the site
- Threat analysis: open the full, plain-language explanation
One Score, Clear Reasons
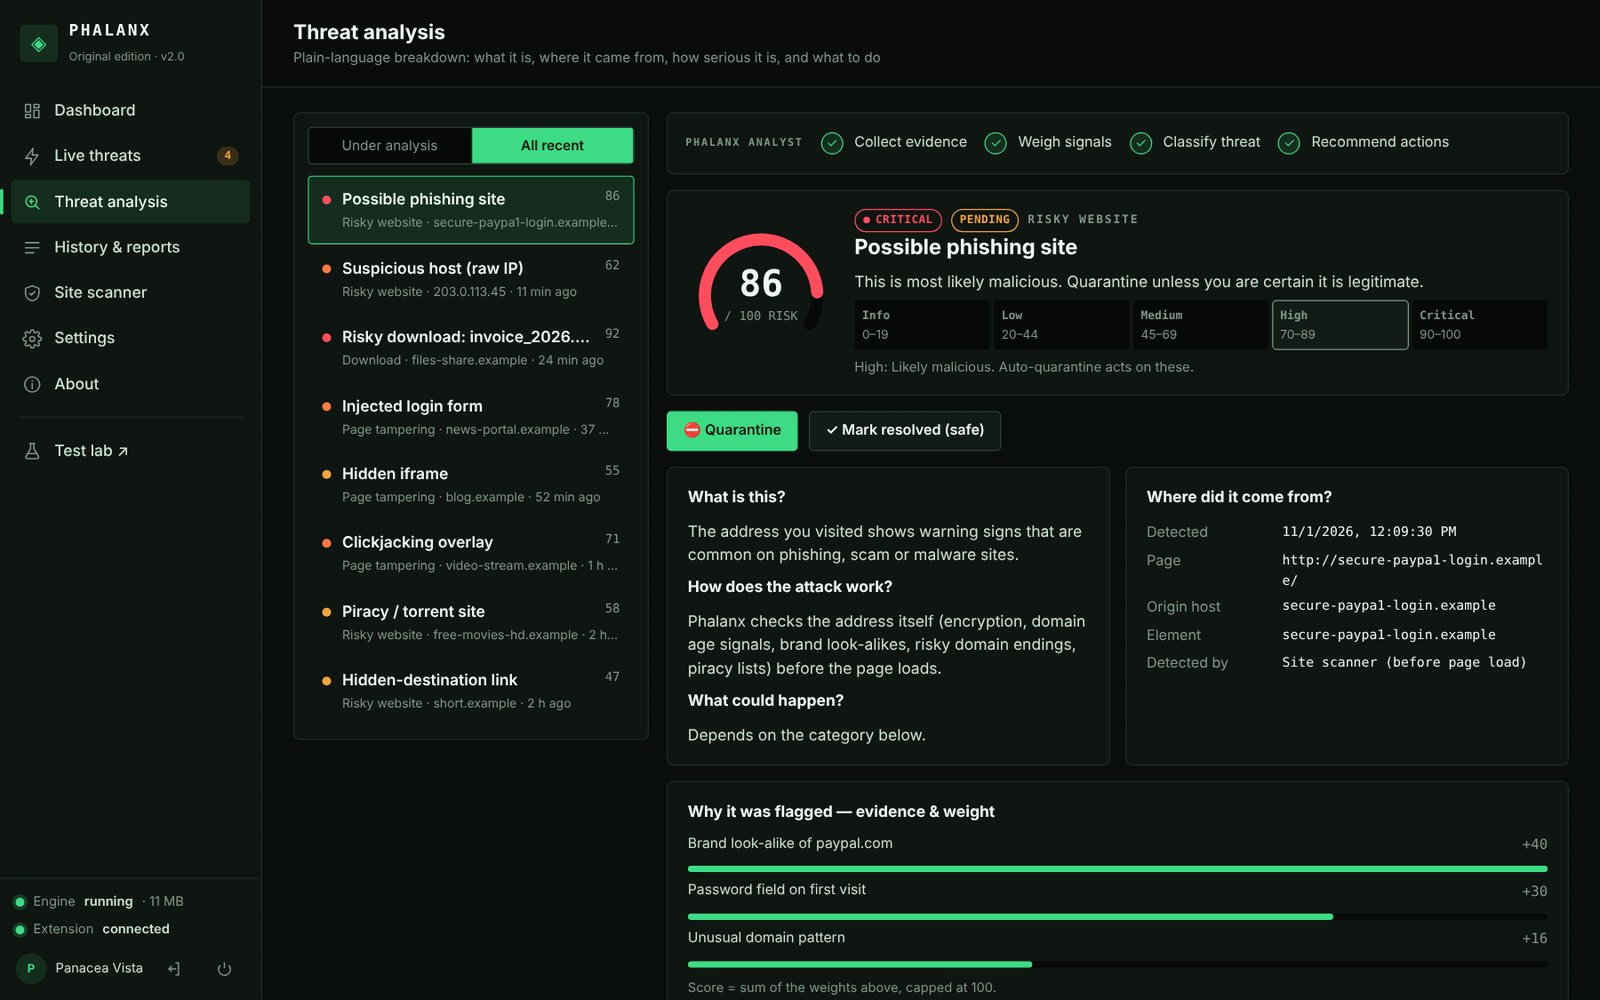
Every warning sign adds points: a raw IP address adds 30, a brand look-alike 40, a disguised .pdf.exe 50, a piracy site 55. Well-known services (Google, Microsoft, GitHub, Netflix, Discord, major Indian banks and .gov.in) are trusted and not flagged.
Low
Alerts at 70 and above: high and critical only, the fewest alerts.
Medium (default)
Alerts at 45 and above: the balanced setting.
High
Alerts at 20 and above: maximum visibility for demos.
Auto-quarantine
Instantly handles high and critical threats when switched on.
History, Reports & On-Demand Scans
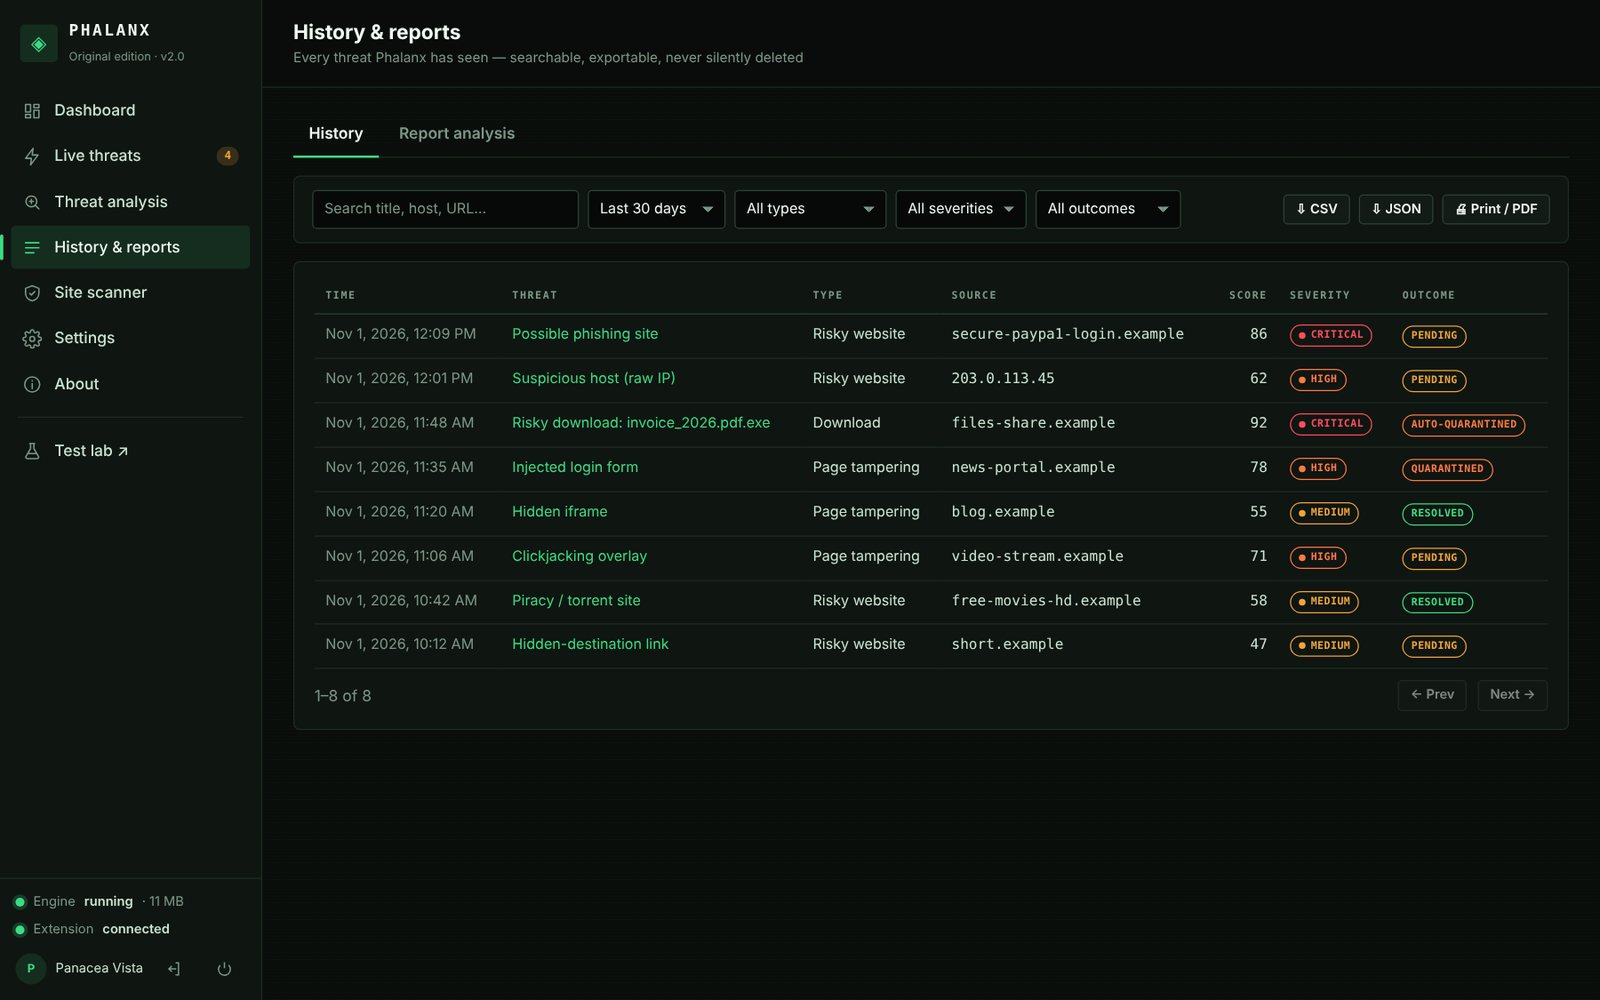
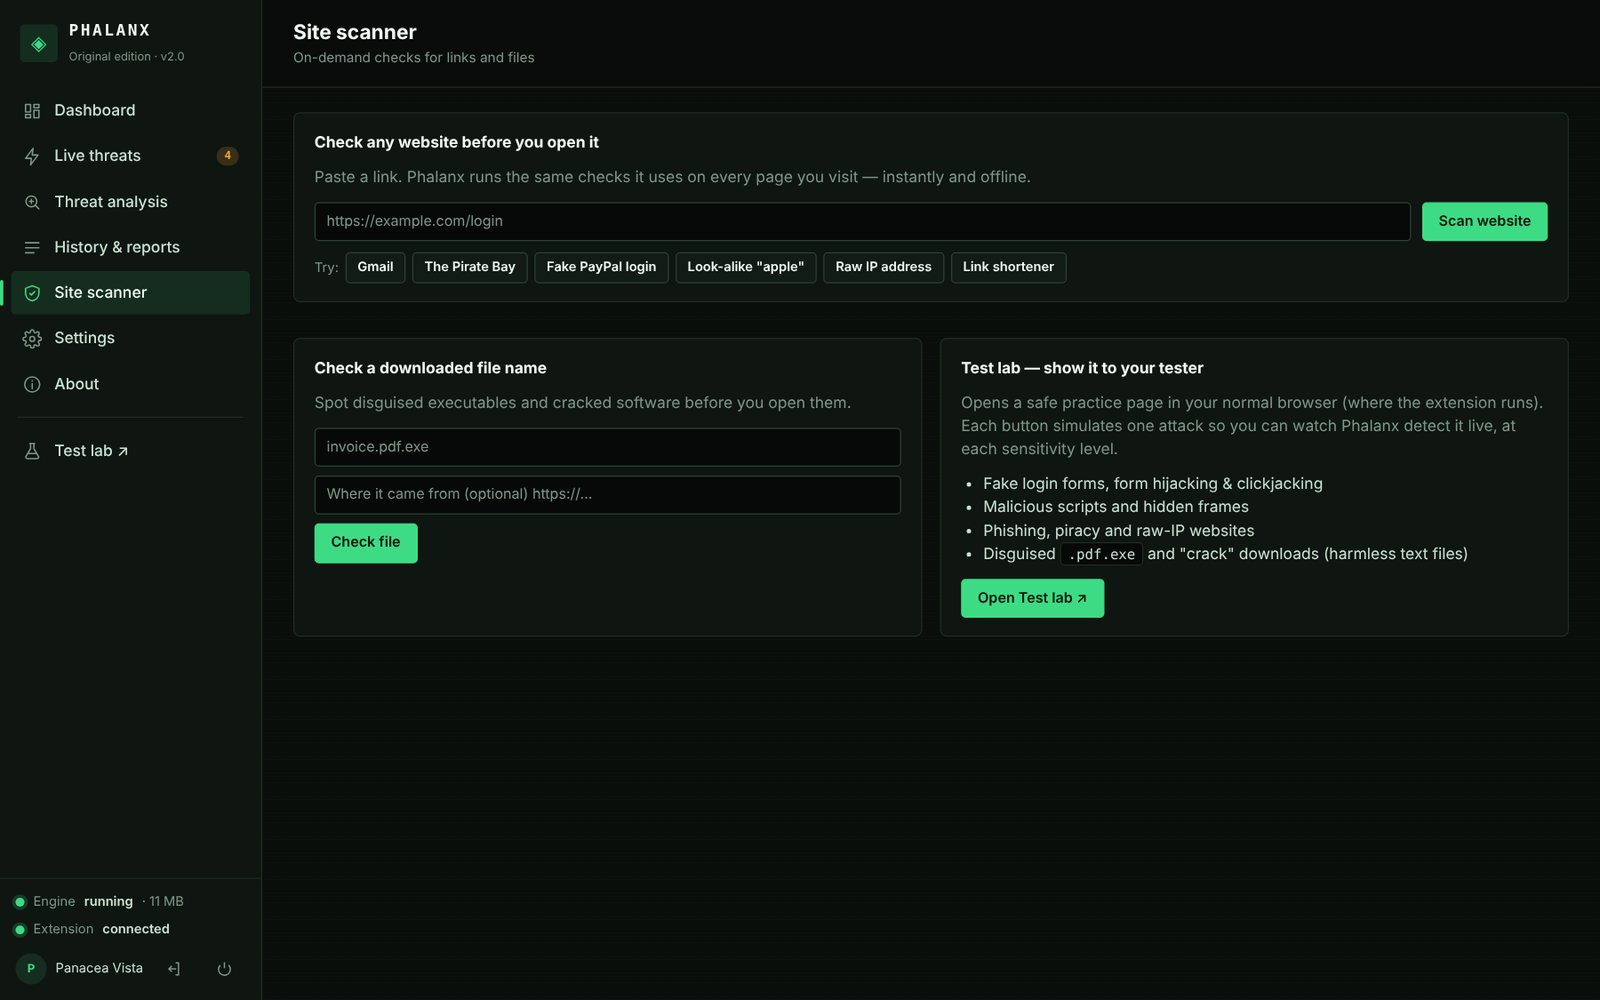
Every threat Phalanx has seen is searchable and exportable (CSV, JSON, print or PDF). The site scanner checks any link or downloaded file name before you open it, using the same rules as the extension, instantly and offline.
- Local only: the extension and engine talk only over 127.0.0.1:47821; nothing is sent to the internet
- Your data folder: history, settings and cache live in PhalanxData, movable from Settings
- Light footprint: checks run in browser idle time; state is saved in batches
Safe, Repeatable Demonstrations
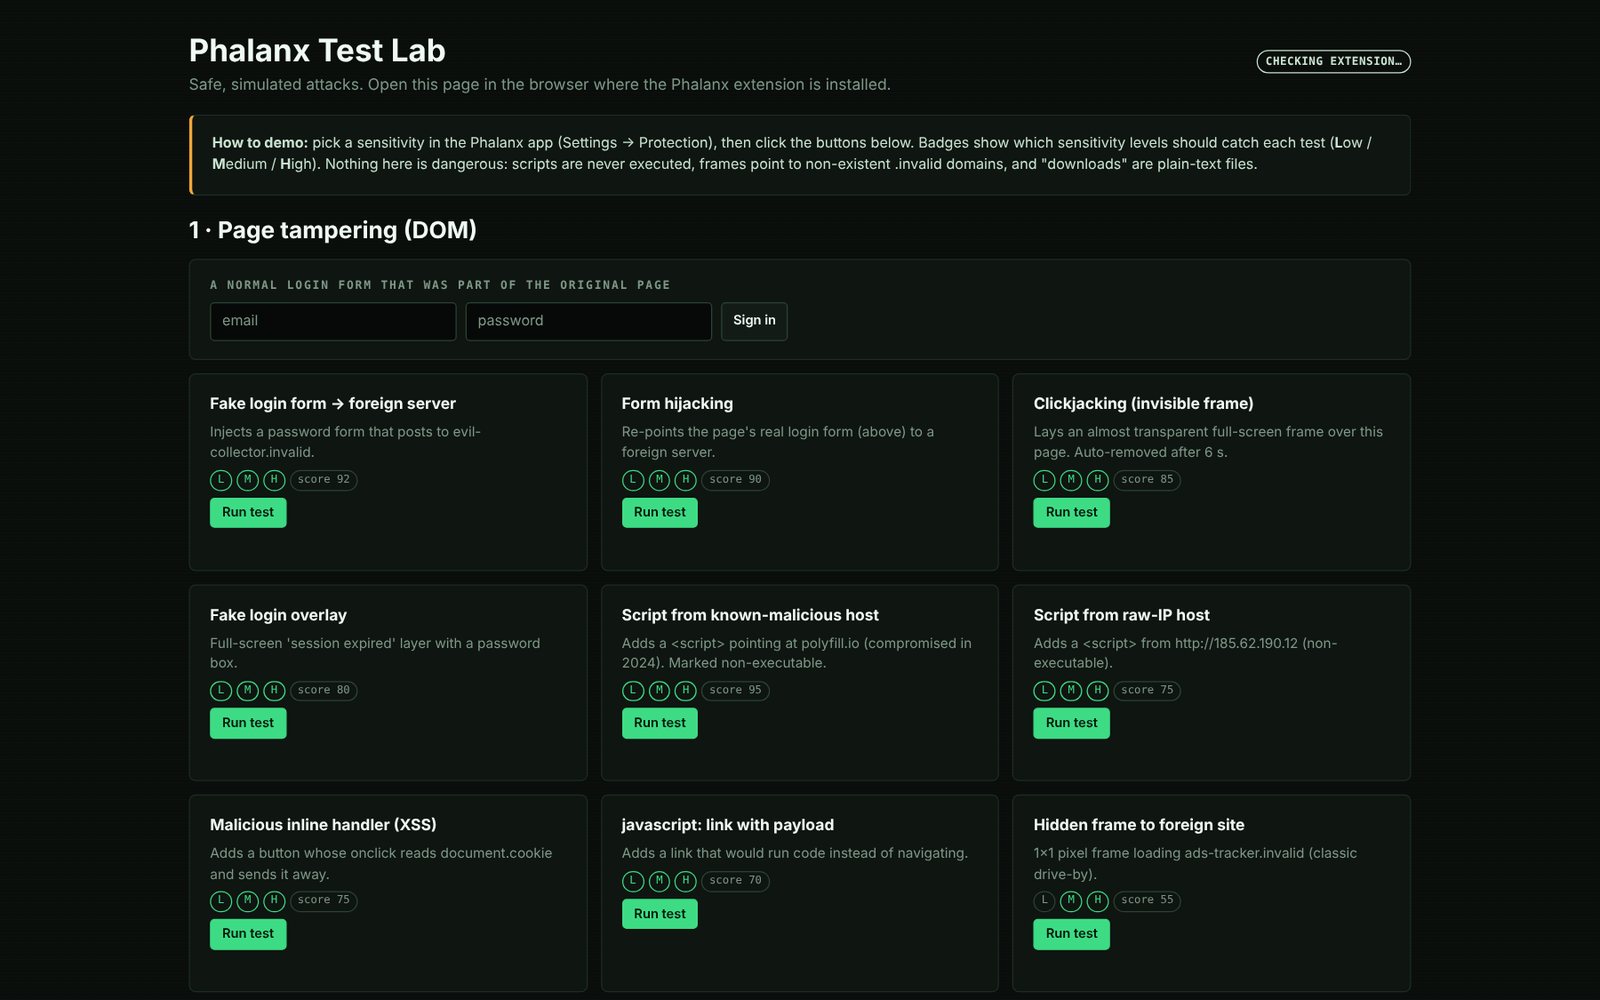
The built-in Test lab opens a practice page in your normal browser. Each button simulates one attack (fake login forms, form hijacking, invisible clickjacking frames, malicious scripts, XSS handlers, hidden frames) and badges show which sensitivity should catch it.
Quickstart & Local Setup Guide
1. Install the Desktop App
- Run
Phalanx-Setup.exe(per-user, no admin) or the portablePhalanx.exe. - SmartScreen may warn: More info → Run anyway.
- Create your local profile (name and optional passcode).
2. Load the Extension
- Open
chrome://extensions(Edge:edge://extensions). - Switch on Developer mode.
- Click Load unpacked and choose the
extensionfolder. - The app sidebar shows Extension connected.
3. Try the Test Lab
- Click Test lab in the app's left menu.
- Pick a sensitivity in Settings → Protection.
- Run each simulated attack and watch the alert.
4. Build from Source
# Go 1.22+, Python 3 + Pillow, NSIS, mingw windres
python3 source/tools/make_icons.py
python3 source/tools/build.py
Original and Pink editions come from the same source; only the palette and icons differ.
Try It Yourself
Run the project live in your browser, or install the open-source build on your own machine.
Run it in your browser
The real Phalanx engine is compiled to WebAssembly and runs in this tab: dashboard, live threats with decisions, threat analysis, history and the site scanner, pre-loaded with sample detections from the test lab.
RUN DEMOBrowser-extension monitoring needs the installed version; the demo shows the engine and app.
Install it on your machine
Install the desktop app and load the Chrome/Edge extension to protect your own browsing; the extension and engine talk only over 127.0.0.1.
INSTALL THE PROJECT (OPEN SOURCE) Source code on GitHubExplore the Source Code
The Windows installer, portable app, Chrome/Edge extension and the complete source: Go engine, HTML/JS app and build tools.
View Repository on GitHub Read about A.R.G.U.S (v1)